Click here to go back to the fuel system page.
Click here to go to the next page of dyno charts.
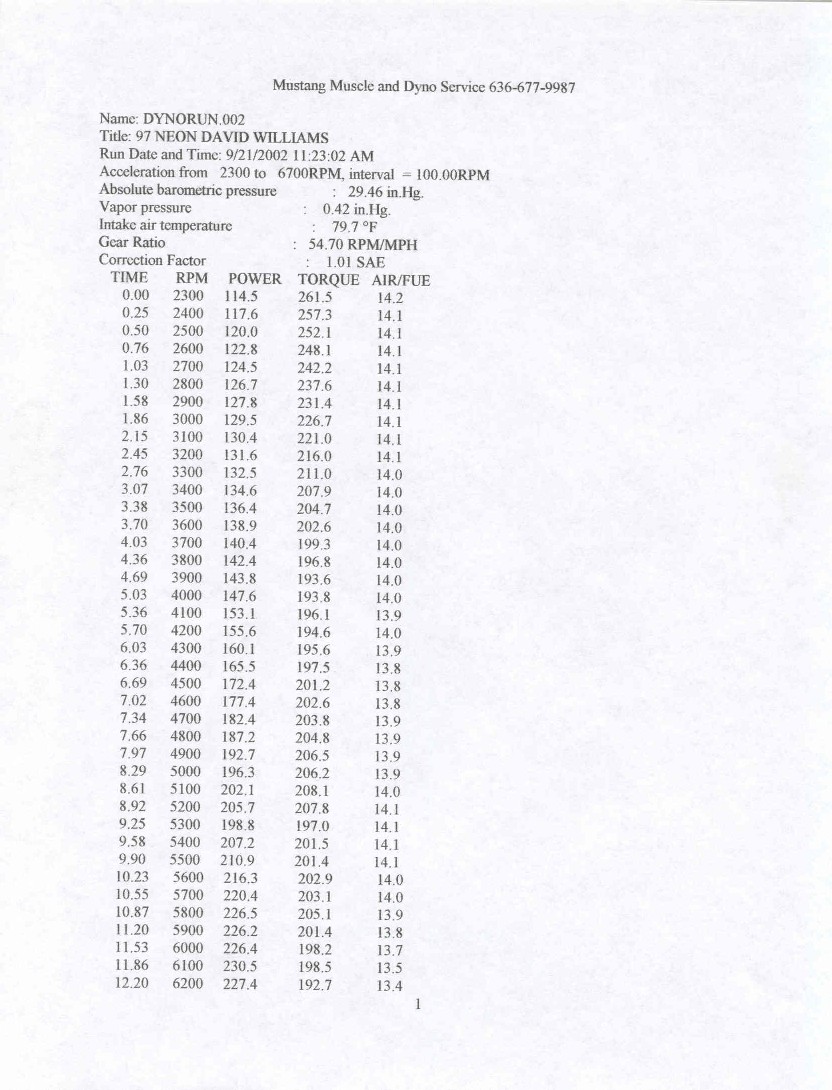
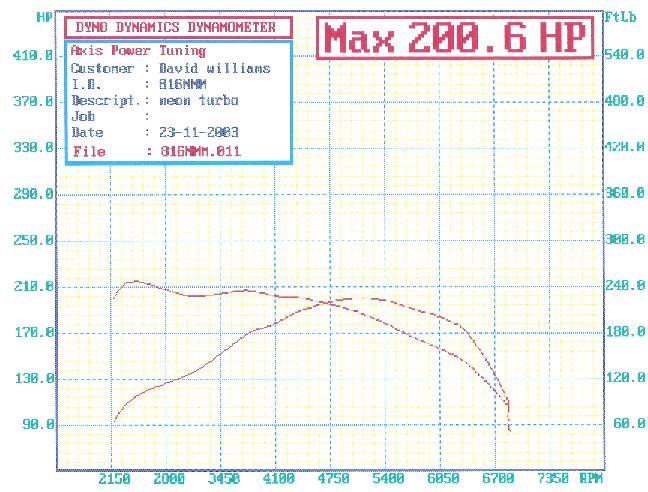
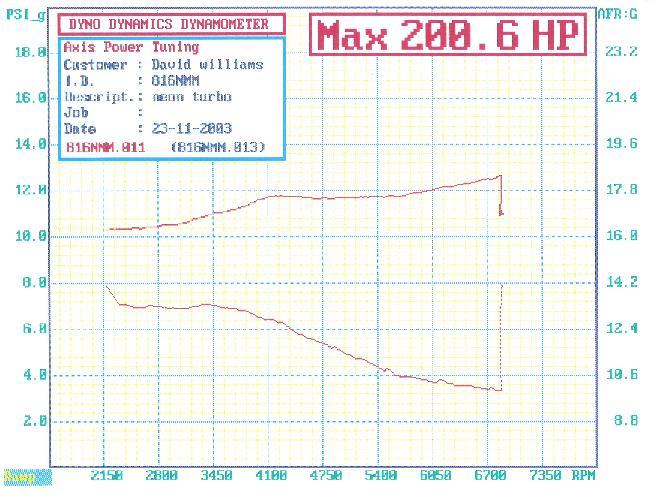
These charts are from the very first dyno runs that the car ever made with the 2.4L turbo engine. As you can see things are not quite the way they should be in the way of AF ratio. It was later found that the cause for this nasty AF ratio was because of a set of injectors that were suppose to be 36pph ones which turned out to be 24pph injectors.
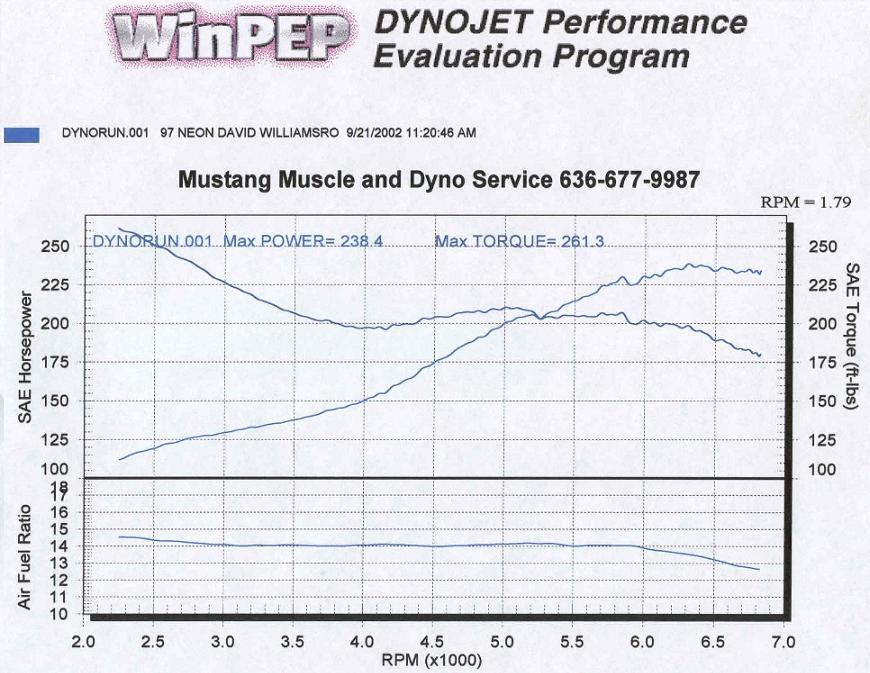 Click on the images below to see the 100rpm interval break down of the dyno run from above.
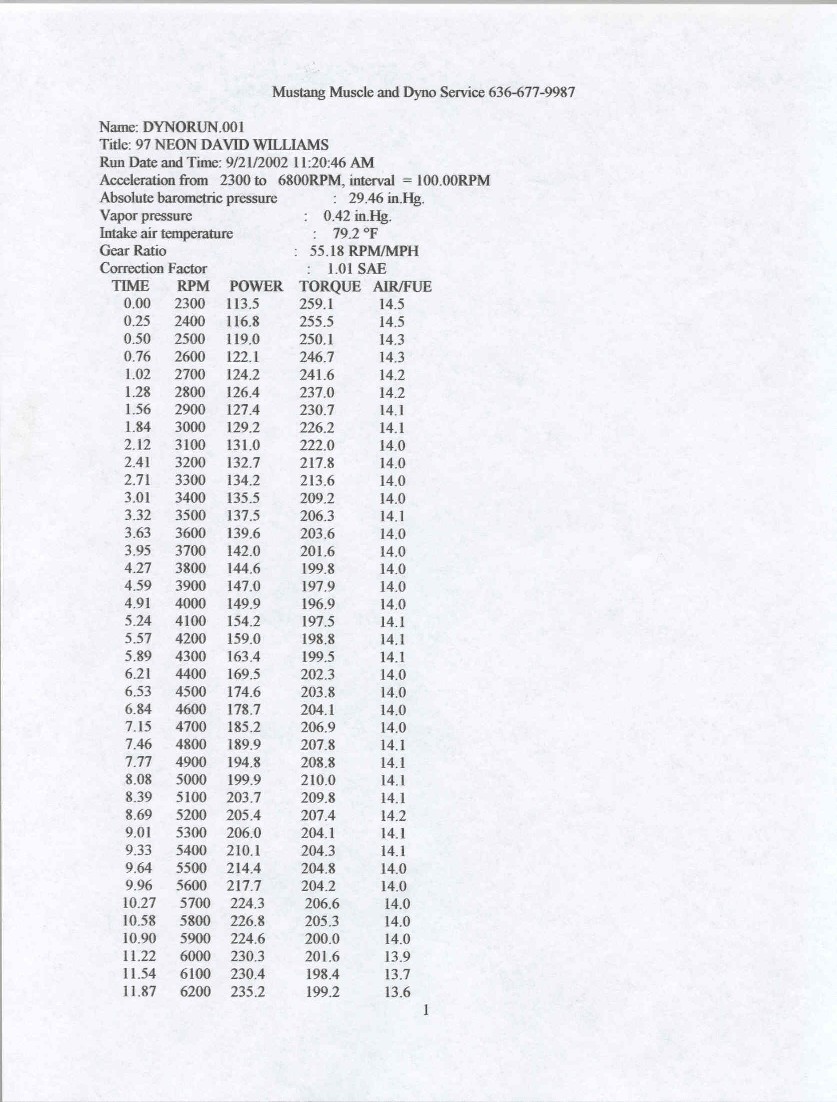

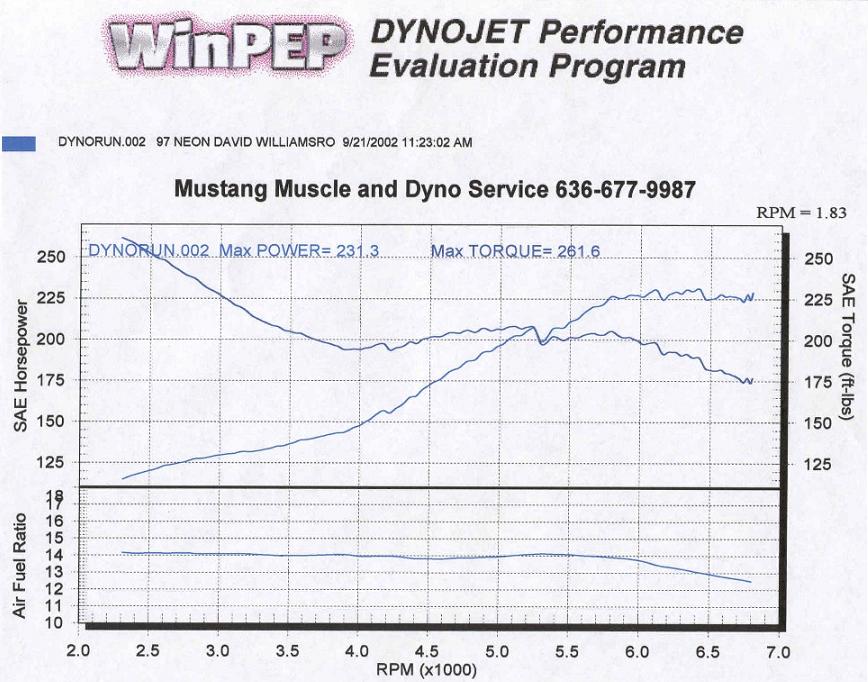 Click on the images below to see the 100rpm interval break down of the dyno run from above.
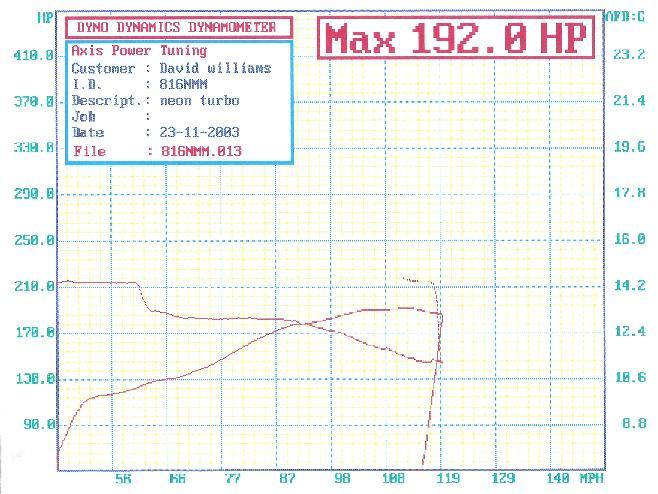
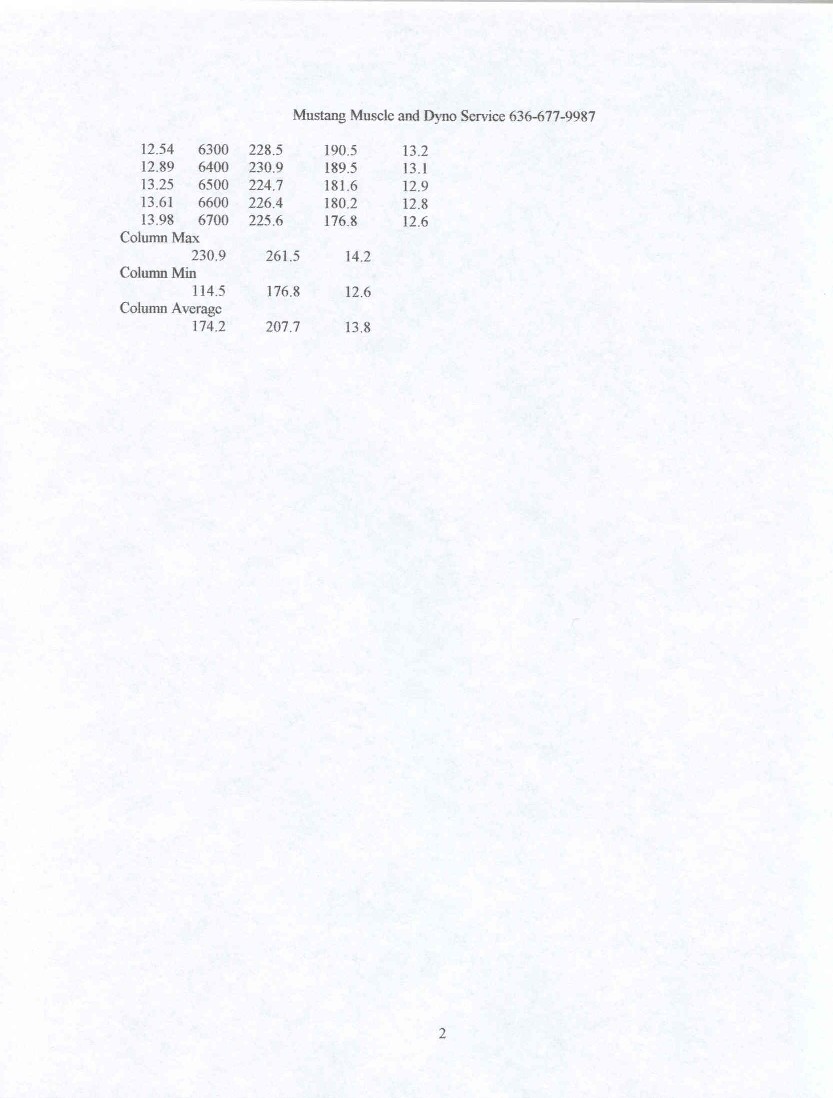 The charts below are of the runs the car made in November 2003 with the larger injectors. The lower numbers are due to the fact that the dyno being used is mostly ment for tuning cars and there is a really high loss factor because of the size of the rollers. As you can see with the new charts the AF has improved but is still not 100%. I am hoping to have the car dialed in the rest of the way in the near future.

 Click here to go to the next page of dyno charts.
Click here to go back to the fuel system page.


